

축 컴포넌트는 위치 스케일에 대한 사람이 읽을 수 있는 참조 표시를 렌더링합니다. 이 컴포넌트는 선형, 로그, 밴드, 시간 스케일을 포함한 대부분의 스케일 유형과 함께 작동합니다. SVG 컨테이너의 선택에 축 컴포넌트를 호출하면 축이 생성됩니다. 축은 원점에서 렌더링됩니다. 차트와 관련하여 축의 위치를 변경하려면 포함하는 요소에 transform 속성을 지정하면됩니다.
x축 이동
const width = 640;
const height = 400;
const marginRight = 20;
const marginBottom = 30;
const marginLeft = 40;

const x = d3.scaleUtc()
    .domain([new Date("2023-01-01"), new Date("2024-01-01")])
    .range([marginLeft, width - marginRight]);

const svg = d3.create("svg")
    .attr("width", width)
    .attr("height", height);

svg.append("g")
    .attr("transform", `translate(0,${height - marginBottom})`)
    .call(d3.axisBottom(x));

container.append(svg.node());
transform 속성을 이용하여 marginBottom을 많이 줄수록 값은 줄어들어서 축이 올라가게 됩니다.
축은 스케일 도메인의 범위를 나타내는 "domain" 클래스의 path 요소로 시작하며, 스케일의 각 틱을 나타내는 "tick" 클래스의 변환된 g 요소로 이어집니다. 각 틱에는 틱 라인을 그리는 line 요소와 틱 라벨을 표시하는 text 요소가 있습니다.
<g class="tick" opacity="1" transform="translate(10,0)">
	<line stroke="currentColor" y2="6"></line>
    <text fill="currentColor" y="9" dy="0.71em">2023</text>
</g>
axisTop(scale)
이 방향에서는 수평 도메인 경로 위에 눈금이 그려집니다.
const x = d3.scaleLinear()
    .domain([0, 10])
    .range([50, 400]);

const svg = d3.create("svg")
    .attr("width", 640)
    .attr("height", 400);

svg.append("g")
    .attr("transform", `translate(0,200)`)
    .call(d3.axisBottom(x));

container.append(svg.node());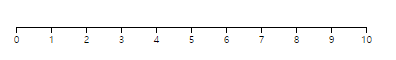
axisRight(scale)
이 방향에서는 수직 도메인 경로의 오른쪽에 눈금이 그려집니다.
const x = d3.scaleLinear()
    .domain([0, 10])
    .range([0, 200]);

const svg = d3.create("svg")
    .attr("width", 640)
    .attr("height", 400);

svg.append("g")
    .attr("transform", `translate(100,100)`)
    .call(d3.axisRight(x));

container.append(svg.node());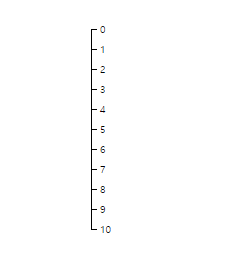
axisBottom(scale)
이 방향에서는 수평 도메인 경로 아래에 눈금이 그려집니다.
const x = d3.scaleLinear()
    .domain([0, 10])
    .range([0, 200]);

const svg = d3.create("svg")
    .attr("width", 640)
    .attr("height", 400);

svg.append("g")
    .attr("transform", `translate(100,100)`)
    .call(d3.axisBottom(x));

container.append(svg.node());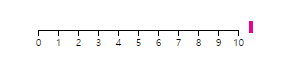
axisLeft(scale)
이 방향에서는 수직 도메인 경로의 왼쪽에 눈금이 그려집니다.
const x = d3.scaleLinear()
    .domain([0, 10])
    .range([0, 200]);

const svg = d3.create("svg")
    .attr("width", 640)
    .attr("height", 400);

svg.append("g")
    .attr("transform", `translate(100,100)`)
    .call(d3.axisLeft(x));

container.append(svg.node());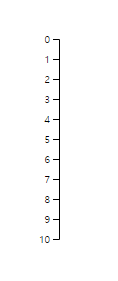
axis.scale(scale)
축(axis)의 스케일(scale)을 설정하거나 가져오는 메서드를 정의하는 부분입니다. 매개변수가 전달되면, 스케일을 설정하고 axis 객체를 반환합니다. 매개변수가 전달되지 않으면 현재 스케일 값을 반환합니다.
const x = d3.scaleLinear()
    .domain([0, 10])
    .range([0, 200]);

const svg = d3.create("svg")
    .attr("width", 640)
    .attr("height", 400);

const newX = d3.scaleLinear()
    .domain([0, 100])
    .range([0, 400]);

const axis = d3.axisTop(x)
axis.scale(newX)

svg.append("g")
    .attr("transform", `translate(100,100)`)
    .call(axis);

container.append(svg.node());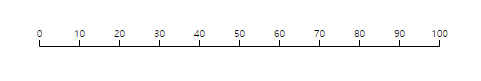
axis.tick(...arguments)
축(axis)을 렌더링할 때 사용될 스케일의 눈금(ticks) 및 눈금 라벨 형식을 설정하는 데 사용됩니다. 이 메서드는 축의 스케일 유형에 따라 의미가 달라집니다. 가장 일반적으로 사용되는 매개변수는 눈금의 개수를 나타내는 정수 또는 시간 스케일의 경우 시간 간격을 나타내는 것과 눈금 값의 형식을 사용자 정의하는 포맷 지정자입니다.
예를 들어, 선형 스케일에서 SI 접두사 형식으로 20개의 눈금을 생성하려면 다음과 같이 사용할 수 있습니다:
const x = d3.scaleLinear()
    .domain([0, 1000000])
    .range([0, 400]);

const svg = d3.create("svg")
    .attr("width", 640)
    .attr("height", 400);

const axis = d3.axisTop(x)
axis.ticks(5, 's')

svg.append("g")
    .attr("transform", `translate(100,100)`)
    .call(axis);

container.append(svg.node());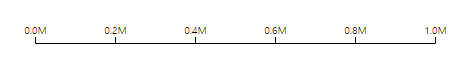
또한 시간 스케일에서 6시마다 눈금을 생성하려면 다음과 같이 사용할 수 있습니다:
const x = d3.scaleUtc()
    .domain([new Date("2023-01-01"), new Date("2023-01-02")])
    .range([0, 400]);

const svg = d3.create("svg")
    .attr("width", 640)
    .attr("height", 400);

const axis = d3.axisTop(x)
axis.ticks(d3.timeHour.every(6))

svg.append("g")
    .attr("transform", `translate(100,100)`)
    .call(axis);

container.append(svg.node());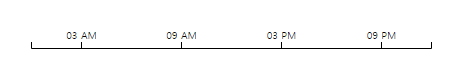
이 메서드는 axis.tickArguments의 편의 함수로 사용될 수 있으며, 스케일이 scale.ticks를 구현하지 않는 경우에는 아무 효과도 없습니다.
이 경우 눈금 값을 직접 설정하려면 axis.tickValues를 사용하고, 눈금 형식을 직접 설정하려면 axis.tickFormat을 사용하면 됩니다. 직접 눈금 값을 생성하려면 scale.ticks를 사용합니다.
axis.tickValues(values)
tickValues 메서드는 축의 눈금(ticks)을 수동으로 설정하거나 지정된 값으로 지정하는 데 사용됩니다.
tickValues를 사용하여 명시적인 눈금 값(특정 값들)을 설정할 수 있습니다. 이는 스케일의 자동 눈금 생성기 대신 사용됩니다.
tickValues는 tickArguments에 설정된 눈금보다 우선입니다. 그러나 눈금 값이 설정되어 있지 않으면 tickformat 함수에 의해 전달됩니다.
tickValues가 null이면 이전에 설정된 눈금 값이 제거되고 스케일의 자동 눈금으로 설정됩니다.
const x = d3.scaleLinear()
    .domain([0,10])
    .range([0, 400]);

const svg = d3.create("svg")
    .attr("width", 640)
    .attr("height", 400);

const axis = d3.axisTop(x)
axis.tickValues([1,4,6])

svg.append("g")
    .attr("transform", `translate(100,100)`)
    .call(axis);

container.append(svg.node());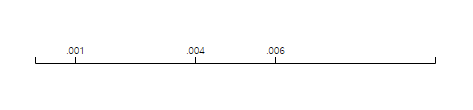
axis.tickFormat(format)
축(axis)의 눈금 값에 대한 형식을 지정하는 데 사용됩니다. 이 메서드를 사용하여 눈금 값이 축에 표시될 때 어떻게 표시되는지를 사용자 정의할 수 있습니다.
format이 지정된 경우, 눈금 값의 형식을 설정하는 데 사용됩니다
const x = d3.scaleLinear()
    .domain([0,1000])
    .range([0, 400]);

const svg = d3.create("svg")
    .attr("width", 640)
    .attr("height", 400);

const axis = d3.axisTop(x)
axis.tickFormat(d3.format(",.0f"))

svg.append("g")
    .attr("transform", `translate(100,100)`)
    .call(axis);

container.append(svg.node());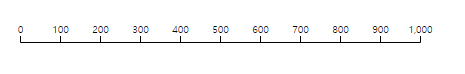
일반적으로 눈금 값에 대한 형식 지정자는 axis.ticks를 통해 설정됩니다. 눈금 간격에 따라 형식 정밀도가 자동으로 설정됩니다.
const x = d3.scaleLinear()
    .domain([0,1000])
    .range([0, 400]);

const svg = d3.create("svg")
    .attr("width", 640)
    .attr("height", 400);

const axis = d3.axisTop(x)
axis.ticks(10, ".2f")

svg.append("g")
    .attr("transform", `translate(100,100)`)
    .call(axis);

container.append(svg.node());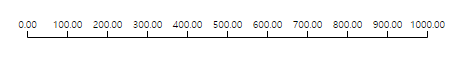
axis.tickArguments에서 설정한 눈금 인수는 scale.tickFormat에 전달됩니다.
axis.tickSize(size)
축(axis)의 눈금 표시에 대한 내부(inner)와 외부(outer) 틱 크기를 설정하는 데 사용됩니다.
size가 지정된 경우, 내부와 외부 틱 크기를 지정한 값으로 설정합니다.
const x = d3.scaleLinear()
    .domain([0,1000])
    .range([0, 400]);

const svg = d3.create("svg")
    .attr("width", 640)
    .attr("height", 400);

const axis = d3.axisTop(x)
axis.tickSize(50)

svg.append("g")
    .attr("transform", `translate(100,100)`)
    .call(axis);

container.append(svg.node());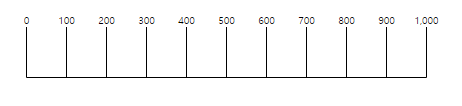
size가 지정되지 않은 경우, 현재 내부 틱 크기를 반환합니다. 내부 틱 크기는 기본적으로 6으로 설정됩니다.
내부 틱 크기는 축의 눈금 표시에 가까운 틱의 크기를 나타냅니다.
외부 틱 크기는 축의 눈금 표시에서 떨어진 틱의 크기를 나타냅니다.
axis.tickSizeInner(size)
크기가 지정되면 내부 틱 크기를 설정합니다.
const x = d3.scaleLinear()
    .domain([0,5])
    .range([0, 400]);

const svg = d3.create("svg")
    .attr("width", 640)
    .attr("height", 400);

const axis = d3.axisTop(x)
axis.tickSizeInner(0)

svg.append("g")
    .attr("transform", `translate(100,100)`)
    .call(axis);

container.append(svg.node());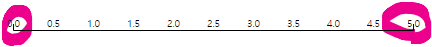
axis.tickSizeOuter(size)
크기가 지정되면 외부 틱 크기를 설정합니다.
const x = d3.scaleLinear()
    .domain([0,5])
    .range([0, 400]);

const svg = d3.create("svg")
    .attr("width", 640)
    .attr("height", 400);

const axis = d3.axisTop(x)
axis.tickSizeOuter(50)

svg.append("g")
    .attr("transform", `translate(100,100)`)
    .call(axis);

container.append(svg.node());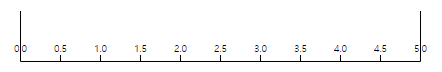
외부 틱 크기는 도메인 경로의 사각형 끝의 길이를 제어하며, 축의 기본 위치에서 오프셋됩니다. 따라서 "외부 틱"은 실제로 틱이 아니라 도메인 경로의 일부이며, 그 위치는 관련 스케일의 도메인 범위에 의해 결정됩니다. 따라서 외부 틱은 첫 번째 또는 마지막 내부 틱과 겹칠 수 있습니다. 외부 틱 크기가 0이면 도메인 경로의 사각형 끝이 제거되어 직선이 생성됩니다.
axis.tickPadding(padding)
패딩이 설정될 경우 지정된 값(픽셀)로 설정됩니다.
const x = d3.scaleLinear()
    .domain([0,5])
    .range([0, 400]);

const svg = d3.create("svg")
    .attr("width", 640)
    .attr("height", 400);

const axis = d3.axisTop(x)
axis.tickPadding(30)

svg.append("g")
    .attr("transform", `translate(100,100)`)
    .call(axis);

container.append(svg.node());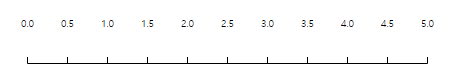
axis.offset(offset)
오프셋이 지정될 경우 픽셀 단위 값으로 설정이 됩니다.
devicePixelRatio가 1보다 큰 경우 기본값은 0이고 그렇지 않으면 0.5입니다.
const x = d3.scaleLinear()
    .domain([0,5])
    .range([0, 400]);

const svg = d3.create("svg")
    .attr("width", 640)
    .attr("height", 400);

const axis = d3.axisTop(x)
axis.offset(50)

svg.append("g")
    .attr("transform", `translate(100,100)`)
    .call(axis);

container.append(svg.node());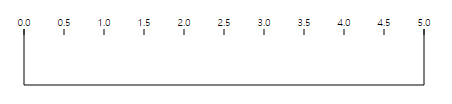
'D3 > 시각화' 카테고리의 다른 글
| [D3] d3-interpolate (Color interpolation) 사용법 (0) | 2023.11.17 |
|---|---|
| [D3] d3-interpolate (Value interpolation) 사용법 (0) | 2023.11.15 |
| [D3] d3-color 사용법 (1) | 2023.11.14 |
| [D3] d3-chords (Ribbons) 사용법 (0) | 2023.11.13 |
| [D3] d3-chords (Chords) 사용법 (1) | 2023.11.13 |